Contents
Getting the Estimate
Displaying the Measurement in the Context of the Estimate
Summary Sequence Diagram
Introduction
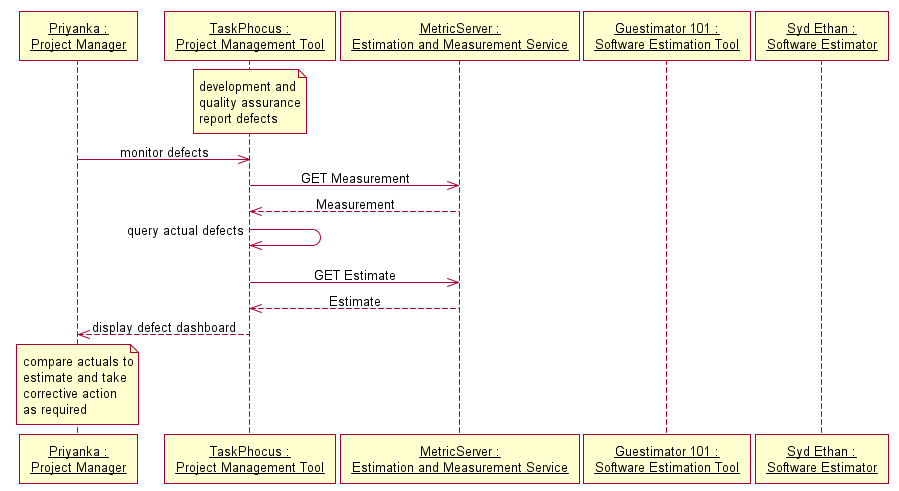
In this act, coding and testing begins. The development and quality assurance teams report defects to TaskPhocus. Priyanka starts her workdays by viewing the defect dashboard and taking any corrective action necessary. When Priyanka views this report, TaskPhocus calculates the current defect arrival rate by running a query against its internal defect tracking database, gets the defect arrival estimate from MetricServer, and combines the results into a report for Priyanka.
Collecting the Measurements
The development team uses TaskPhocus for defect tracking. TaskPhocus provides a query service that allows other tools to get the defect data stored in its defect tracking system. TaskPhocus can provide this data in any of several formats, one of them being the format specified by EMS 1.0. TaskPhocus also includes a basic reporting capability which Priyanka uses to monitor the defect arrival rate.
TaskPhocus can also provide data to a data warehouse that has more advanced analytical capabilities. For simplicity, we’ll assume Priyanka uses the built-in reporting capability of TaskPhocus in this scenario since she is only concerned about her project. Her managers will be interested in the quality metrics for all the projects and will probably prefer using the more advanced analytical capabilities of the data warehouse. The interactions with MetricServer are similar in both cases.
Monitoring the Measurement
In Act 2. Estimation, Priyanka defined a defect arrival rate report and added it to her TaskPhocus dashboard. Priyanka now wants to monitor this metric so she invokes the Open Dashboard command in TaskPhocus. TaskPhocus must now run the report and therefore needs to get the measurements and the estimates. For simplicity, let’s assume that the TaskPhocus report definition includes the URIs for the ems:Measurement and associated ems:Estimate resources in MetricServer. In this example, the URI for the ems:Measurement resource is:
http://braintwistors.example.com/ems10/Measurement/6109
Getting the Measurement Data
The TaskPhocus reporting engine GETs the ems:Measurement URI. MetricServer returns the following representation:
Listing of Measurement 6109
<?xml version="1.0"?>
<ems:Measurement xmlns:rdf="http://www.w3.org/1999/02/22-rdf-syntax-ns#"
   xmlns:dcterms="http://purl.org/dc/terms/" xmlns:ems="http://open-services.net/ns/ems#"
   rdf:about="http://braintwistors.example.com/ems10/Measurement/6109"
   xml:base="http://braintwistors.example.com/ems10/Measurement/6109">
   <dcterms:title rdf:parseType="Literal">Tsunami 1.0 Monthly Defect Arrival
      Rate Measurement from
      [TaskPhocus](TaskPhocus.html)
   </dcterms:title>
   <dcterms:description rdf:parseType="Literal">
    A. live [TaskPhocus](TaskPhocus.html) query is
      the source of this
      measurement.
   </dcterms:description>
   <dcterms:identifier>6109</dcterms:identifier>
   <ems:measurementList
      rdf:resource="http://braintwistors.example.com/ems10/Measurement" />
   <ems:project rdf:resource="http://braintwistors.example.com/ems10/Project/4201" />
   <ems:observesTable>
      <ems:FactTable>
         <dcterms:title rdf:parseType="Literal">Defect Arrival Rate by Elapsed Month
         </dcterms:title>
         <ems:head>
            <ems:Head>
               <ems:dimensionColumn>
                  <ems:DimensionColumn rdf:ID="d1">
                     <dcterms:title rdf:parseType="Literal">Month</dcterms:title>
                     <ems:dimension
                        rdf:resource="http://open-services.net/ns/ems/dimension#Time" />
                     <ems:grain
                        rdf:resource="http://open-services.net/ns/ems/grain#ElapsedMonth" />
                  </ems:DimensionColumn>
               </ems:dimensionColumn>
               <ems:measureColumn>
                  <ems:MeasureColumn rdf:ID="m1">
                     <dcterms:title rdf:parseType="Literal">Reported Problems</dcterms:title>
                     <ems:metric
                        rdf:resource="http://open-services.net/ns/ems/metric#Failures" />
                     <ems:unitOfMeasure
                        rdf:resource="http://open-services.net/ns/ems/unit#Failure" />
                  </ems:MeasureColumn>
               </ems:measureColumn>
            </ems:Head>
         </ems:head>
         <ems:tableSource
            rdf:resource="http://braintwistors.example.com/taskphocus/Query/3365" />
      </ems:FactTable>
   </ems:observesTable>
   <!--
      Other properties of this resource have been omitted for brevity.
   -->
</ems:Measurement>
This resource does not directly contain the measurements. Instead, it has an ems:observationSource property that refers to the URI for a query defined on the TaskPhocus defect tracking system:
http://braintwistors.example.com/taskphocus/Query/3365
Let’s suppose that we are five months into the project and the actual defect arrival rates are as follows:
Table of Defect Arrival Rate Measurements
| Month |
Found Defects |
| 1 |
28 |
| 2 |
75 |
| 3 |
104 |
| 4 |
98 |
| 5 |
75 |
The TaskPhocus report engine GETs the above query URI and the TaskPhocus defect tracking systems returns the following defect arrival rate measurements:
Listing of Defect Arrival Rate Measurements
<?xml version="1.0"?>
<ems:FactTable xmlns:ems="http://open-services.net/ns/ems#"
   xmlns:rdf="http://www.w3.org/1999/02/22-rdf-syntax-ns#" xmlns:dcterms="http://purl.org/dc/terms/"
   xml:base="http://braintwistors.example.com/ems10/Measurement/6109">
   <dcterms:title rdf:parseType="Literal">Table of Found Defects by
      Month
   </dcterms:title>
   <ems:head>
      <ems:Head>
         <ems:dimensionColumn>
            <ems:DimensionColumn rdf:ID="d1">
               <dcterms:title rdf:parseType="Literal">Month</dcterms:title>
               <ems:dimension rdf:resource="http://open-services.net/ns/ems/dimension#Time" />
               <ems:grain rdf:resource="http://open-services.net/ns/ems/grain#ElapsedMonth" />
            </ems:DimensionColumn>
         </ems:dimensionColumn>
         <ems:measureColumn>
            <ems:MeasureColumn rdf:ID="m1">
               <dcterms:title rdf:parseType="Literal">Reported Problems
               </dcterms:title>
               <ems:metric rdf:resource="http://open-services.net/ns/ems/metric#Failures" />
               <ems:unitOfMeasure rdf:resource="http://open-services.net/ns/ems/unit#Failure" />
            </ems:MeasureColumn>
         </ems:measureColumn>
      </ems:Head>
   </ems:head>
   <ems:fact>
      <ems:Fact>
         <ems:dimensionCell>
            <ems:DimensionCell>
               <ems:inColumn rdf:resource="#d1" />
               <ems:dimensionMember
                  rdf:resource="http://open-services.net/ns/ems/dimension-member/ElapsedMonth/1" />
            </ems:DimensionCell>
         </ems:dimensionCell>
         <ems:measureCell>
            <ems:MeasureCell>
               <ems:inColumn rdf:resource="#m1" />
               <ems:numericValue rdf:datatype="http://www.w3.org/2001/XMLSchema#double">28</ems:numericValue>
            </ems:MeasureCell>
         </ems:measureCell>
      </ems:Fact>
   </ems:fact>
   <ems:fact>
      <ems:Fact>
         <ems:dimensionCell>
            <ems:DimensionCell>
               <ems:inColumn rdf:resource="#d1" />
               <ems:dimensionMember
                  rdf:resource="http://open-services.net/ns/ems/dimension-member/ElapsedMonth/2" />
            </ems:DimensionCell>
         </ems:dimensionCell>
         <ems:measureCell>
            <ems:MeasureCell>
               <ems:inColumn rdf:resource="#m1" />
               <ems:numericValue rdf:datatype="http://www.w3.org/2001/XMLSchema#double">75</ems:numericValue>
            </ems:MeasureCell>
         </ems:measureCell>
      </ems:Fact>
   </ems:fact>
   <ems:fact>
      <ems:Fact>
         <ems:dimensionCell>
            <ems:DimensionCell>
               <ems:inColumn rdf:resource="#d1" />
               <ems:dimensionMember
                  rdf:resource="http://open-services.net/ns/ems/dimension-member/ElapsedMonth/3" />
            </ems:DimensionCell>
         </ems:dimensionCell>
         <ems:measureCell>
            <ems:MeasureCell>
               <ems:inColumn rdf:resource="#m1" />
               <ems:numericValue rdf:datatype="http://www.w3.org/2001/XMLSchema#double">104</ems:numericValue>
            </ems:MeasureCell>
         </ems:measureCell>
      </ems:Fact>
   </ems:fact>
   <ems:fact>
      <ems:Fact>
         <ems:dimensionCell>
            <ems:DimensionCell>
               <ems:inColumn rdf:resource="#d1" />
               <ems:dimensionMember
                  rdf:resource="http://open-services.net/ns/ems/dimension-member/ElapsedMonth/4" />
            </ems:DimensionCell>
         </ems:dimensionCell>
         <ems:measureCell>
            <ems:MeasureCell>
               <ems:inColumn rdf:resource="#m1" />
               <ems:numericValue rdf:datatype="http://www.w3.org/2001/XMLSchema#double">98</ems:numericValue>
            </ems:MeasureCell>
         </ems:measureCell>
      </ems:Fact>
   </ems:fact>
   <ems:fact>
      <ems:Fact>
         <ems:dimensionCell>
            <ems:DimensionCell>
               <ems:inColumn rdf:resource="#d1" />
               <ems:dimensionMember
                  rdf:resource="http://open-services.net/ns/ems/dimension-member/ElapsedMonth/5" />
            </ems:DimensionCell>
         </ems:dimensionCell>
         <ems:measureCell>
            <ems:MeasureCell>
               <ems:inColumn rdf:resource="#m1" />
               <ems:numericValue rdf:datatype="http://www.w3.org/2001/XMLSchema#double">75</ems:numericValue>
            </ems:MeasureCell>
         </ems:measureCell>
      </ems:Fact>
   </ems:fact>
</ems:FactTable>
The query response is simply a copy of the ems:observe element of the ems:Measurement resource with the actual observations filled in. Each observation is wrapped in an ems:Observation element. Note that this formal is literal XML since the order of elements within each ems:Observation element is significant. In general there may be several dimensions and several measures in a result table. (Author’s note: I expect to evolve this format to make it more aligned with RDF).
Getting the Estimate
Next, the TaskPhocus reporting engine GETs the ems:Estimate URI. The URI for the ems:Estimate is:
http://braintwistors.example.com/ems10/Estimate/7349
MetricServer returns the ems:Estimate resource:
Listing of Estimate 7349
<?xml version="1.0"?>
<ems:Estimate xmlns:rdf="http://www.w3.org/1999/02/22-rdf-syntax-ns#"
   xmlns:dcterms="http://purl.org/dc/terms/" xmlns:ems="http://open-services.net/ns/ems#"
   rdf:about="http://braintwistors.example.com/ems10/Estimate/7349"
   xml:base="http://braintwistors.example.com/ems10/Estimate/7349">
   <dcterms:title rdf:parseType="Literal">Tsunami 1.0 Monthly Defect
    Arrival
      Rate Estimate by
      Guestimator 101
   </dcterms:title>
   <dcterms:description rdf:parseType="Literal">
      Guestimator 101
      uses
      Rayleigh distribution with arrival
      rate peak at 2.5 months and
      triangular distribution for defect density
      with a low of 7
      defects/KLOC, a most likely of 8 defects/KLOC, and a
      high of 10
      defects/KLOC.
   </dcterms:description>
   <dcterms:identifier>7349</dcterms:identifier>
   <ems:estimateList rdf:resource="http://braintwistors.example.com/ems10/Estimate" />
   <ems:scenario rdf:resource="http://braintwistors.example.com/ems10/Scenario/5721" />
   <ems:predictsTable>
      <ems:FactDistributionTable>
         <dcterms:title rdf:parseType="Literal">Defect Arrival Count by
            Elapsed
            Month</dcterms:title>
         <ems:head>
            <ems:Head>
               <ems:dimensionColumn>
                  <ems:DimensionColumn rdf:ID="d1">
                     <dcterms:title rdf:parseType="Literal">Month</dcterms:title>
                     <ems:dimension rdf:resource="http://open-services.net/ns/ems/dimension#Time" />
                     <ems:grain rdf:resource="http://open-services.net/ns/ems/grain#ElapsedMonth" />
                  </ems:DimensionColumn>
               </ems:dimensionColumn>
               <ems:measureColumn>
                  <ems:MeasureColumn rdf:ID="m1">
                     <dcterms:title rdf:parseType="Literal">Reported Problems
                     </dcterms:title>
                     <ems:metric rdf:resource="http://open-services.net/ns/ems/metric#Failures" />
                     <ems:unitOfMeasure rdf:resource="http://open-services.net/ns/ems/unit#Failure" />
                  </ems:MeasureColumn>
               </ems:measureColumn>
            </ems:Head>
         </ems:head>
         <ems:factDistribution>
            <ems:FactDistribution>
               <ems:dimensionCell>
                  <ems:DimensionCell>
                     <ems:inColumn rdf:resource="#d1" />
                     <ems:dimensionMember
                        rdf:resource="http://open-services.net/ns/ems/dimension-member/ElapsedMonth/1" />
                  </ems:DimensionCell>
               </ems:dimensionCell>
               <ems:measureDistributionCell>
                  <ems:MeasureDistributionCell>
                     <ems:inColumn rdf:resource="#m1" />
                     <ems:distribution>
                        <ems:TriangularDistribution>
                           <ems:low rdf:datatype="http://www.w3.org/2001/XMLSchema#double">27</ems:low>
                           <ems:mostLikely rdf:datatype="http://www.w3.org/2001/XMLSchema#double">31</ems:mostLikely>
                           <ems:high rdf:datatype="http://www.w3.org/2001/XMLSchema#double">38</ems:high>
                        </ems:TriangularDistribution>
                     </ems:distribution>
                  </ems:MeasureDistributionCell>
               </ems:measureDistributionCell>
            </ems:FactDistribution>
         </ems:factDistribution>
         <ems:factDistribution>
            <ems:FactDistribution>
               <ems:dimensionCell>
                  <ems:DimensionCell>
                     <ems:inColumn rdf:resource="#d1" />
                     <ems:dimensionMember
                        rdf:resource="http://open-services.net/ns/ems/dimension-member/ElapsedMonth/2" />
                  </ems:DimensionCell>
               </ems:dimensionCell>
               <ems:measureDistributionCell>
                  <ems:MeasureDistributionCell>
                     <ems:inColumn rdf:resource="#m1" />
                     <ems:distribution>
                        <ems:TriangularDistribution>
                           <ems:low rdf:datatype="http://www.w3.org/2001/XMLSchema#double">69</ems:low>
                           <ems:mostLikely rdf:datatype="http://www.w3.org/2001/XMLSchema#double">79</ems:mostLikely>
                           <ems:high rdf:datatype="http://www.w3.org/2001/XMLSchema#double">98</ems:high>
                        </ems:TriangularDistribution>
                     </ems:distribution>
                  </ems:MeasureDistributionCell>
               </ems:measureDistributionCell>
            </ems:FactDistribution>
         </ems:factDistribution>
         <ems:factDistribution>
            <ems:FactDistribution>
               <ems:dimensionCell>
                  <ems:DimensionCell>
                     <ems:inColumn rdf:resource="#d1" />
                     <ems:dimensionMember
                        rdf:resource="http://open-services.net/ns/ems/dimension-member/ElapsedMonth/3" />
                  </ems:DimensionCell>
               </ems:dimensionCell>
               <ems:measureDistributionCell>
                  <ems:MeasureDistributionCell>
                     <ems:inColumn rdf:resource="#m1" />
                     <ems:distribution>
                        <ems:TriangularDistribution>
                           <ems:low rdf:datatype="http://www.w3.org/2001/XMLSchema#double">84</ems:low>
                           <ems:mostLikely rdf:datatype="http://www.w3.org/2001/XMLSchema#double">96</ems:mostLikely>
                           <ems:high rdf:datatype="http://www.w3.org/2001/XMLSchema#double">120</ems:high>
                        </ems:TriangularDistribution>
                     </ems:distribution>
                  </ems:MeasureDistributionCell>
               </ems:measureDistributionCell>
            </ems:FactDistribution>
         </ems:factDistribution>
         <ems:factDistribution>
            <ems:FactDistribution>
               <ems:dimensionCell>
                  <ems:DimensionCell>
                     <ems:inColumn rdf:resource="#d1" />
                     <ems:dimensionMember
                        rdf:resource="http://open-services.net/ns/ems/dimension-member/ElapsedMonth/4" />
                  </ems:DimensionCell>
               </ems:dimensionCell>
               <ems:measureDistributionCell>
                  <ems:MeasureDistributionCell>
                     <ems:inColumn rdf:resource="#m1" />
                     <ems:distribution>
                        <ems:TriangularDistribution>
                           <ems:low rdf:datatype="http://www.w3.org/2001/XMLSchema#double">73</ems:low>
                           <ems:mostLikely rdf:datatype="http://www.w3.org/2001/XMLSchema#double">83</ems:mostLikely>
                           <ems:high rdf:datatype="http://www.w3.org/2001/XMLSchema#double">104</ems:high>
                        </ems:TriangularDistribution>
                     </ems:distribution>
                  </ems:MeasureDistributionCell>
               </ems:measureDistributionCell>
            </ems:FactDistribution>
         </ems:factDistribution>
         <ems:factDistribution>
            <ems:FactDistribution>
               <ems:dimensionCell>
                  <ems:DimensionCell>
                     <ems:inColumn rdf:resource="#d1" />
                     <ems:dimensionMember
                        rdf:resource="http://open-services.net/ns/ems/dimension-member/ElapsedMonth/5" />
                  </ems:DimensionCell>
               </ems:dimensionCell>
               <ems:measureDistributionCell>
                  <ems:MeasureDistributionCell>
                     <ems:inColumn rdf:resource="#m1" />
                     <ems:distribution>
                        <ems:TriangularDistribution>
                           <ems:low rdf:datatype="http://www.w3.org/2001/XMLSchema#double">50</ems:low>
                           <ems:mostLikely rdf:datatype="http://www.w3.org/2001/XMLSchema#double">57</ems:mostLikely>
                           <ems:high rdf:datatype="http://www.w3.org/2001/XMLSchema#double">71</ems:high>
                        </ems:TriangularDistribution>
                     </ems:distribution>
                  </ems:MeasureDistributionCell>
               </ems:measureDistributionCell>
            </ems:FactDistribution>
         </ems:factDistribution>
         <ems:factDistribution>
            <ems:FactDistribution>
               <ems:dimensionCell>
                  <ems:DimensionCell>
                     <ems:inColumn rdf:resource="#d1" />
                     <ems:dimensionMember
                        rdf:resource="http://open-services.net/ns/ems/dimension-member/ElapsedMonth/6" />
                  </ems:DimensionCell>
               </ems:dimensionCell>
               <ems:measureDistributionCell>
                  <ems:MeasureDistributionCell>
                     <ems:inColumn rdf:resource="#m1" />
                     <ems:distribution>
                        <ems:TriangularDistribution>
                           <ems:low rdf:datatype="http://www.w3.org/2001/XMLSchema#double">28</ems:low>
                           <ems:mostLikely rdf:datatype="http://www.w3.org/2001/XMLSchema#double">32</ems:mostLikely>
                           <ems:high rdf:datatype="http://www.w3.org/2001/XMLSchema#double">40</ems:high>
                        </ems:TriangularDistribution>
                     </ems:distribution>
                  </ems:MeasureDistributionCell>
               </ems:measureDistributionCell>
            </ems:FactDistribution>
         </ems:factDistribution>
         <ems:factDistribution>
            <ems:FactDistribution>
               <ems:dimensionCell>
                  <ems:DimensionCell>
                     <ems:inColumn rdf:resource="#d1" />
                     <ems:dimensionMember
                        rdf:resource="http://open-services.net/ns/ems/dimension-member/ElapsedMonth/7" />
                  </ems:DimensionCell>
               </ems:dimensionCell>
               <ems:measureDistributionCell>
                  <ems:MeasureDistributionCell>
                     <ems:inColumn rdf:resource="#m1" />
                     <ems:distribution>
                        <ems:TriangularDistribution>
                           <ems:low rdf:datatype="http://www.w3.org/2001/XMLSchema#double">13</ems:low>
                           <ems:mostLikely rdf:datatype="http://www.w3.org/2001/XMLSchema#double">15</ems:mostLikely>
                           <ems:high rdf:datatype="http://www.w3.org/2001/XMLSchema#double">18</ems:high>
                        </ems:TriangularDistribution>
                     </ems:distribution>
                  </ems:MeasureDistributionCell>
               </ems:measureDistributionCell>
            </ems:FactDistribution>
         </ems:factDistribution>
         <ems:factDistribution>
            <ems:FactDistribution>
               <ems:dimensionCell>
                  <ems:DimensionCell>
                     <ems:inColumn rdf:resource="#d1" />
                     <ems:dimensionMember
                        rdf:resource="http://open-services.net/ns/ems/dimension-member/ElapsedMonth/8" />
                  </ems:DimensionCell>
               </ems:dimensionCell>
               <ems:measureDistributionCell>
                  <ems:MeasureDistributionCell>
                     <ems:inColumn rdf:resource="#m1" />
                     <ems:distribution>
                        <ems:TriangularDistribution>
                           <ems:low rdf:datatype="http://www.w3.org/2001/XMLSchema#double">5</ems:low>
                           <ems:mostLikely rdf:datatype="http://www.w3.org/2001/XMLSchema#double">6</ems:mostLikely>
                           <ems:high rdf:datatype="http://www.w3.org/2001/XMLSchema#double">7</ems:high>
                        </ems:TriangularDistribution>
                     </ems:distribution>
                  </ems:MeasureDistributionCell>
               </ems:measureDistributionCell>
            </ems:FactDistribution>
         </ems:factDistribution>
         <ems:factDistribution>
            <ems:FactDistribution>
               <ems:dimensionCell>
                  <ems:DimensionCell>
                     <ems:inColumn rdf:resource="#d1" />
                     <ems:dimensionMember
                        rdf:resource="http://open-services.net/ns/ems/dimension-member/ElapsedMonth/9" />
                  </ems:DimensionCell>
               </ems:dimensionCell>
               <ems:measureDistributionCell>
                  <ems:MeasureDistributionCell>
                     <ems:inColumn rdf:resource="#m1" />
                     <ems:distribution>
                        <ems:TriangularDistribution>
                           <ems:low rdf:datatype="http://www.w3.org/2001/XMLSchema#double">2</ems:low>
                           <ems:mostLikely rdf:datatype="http://www.w3.org/2001/XMLSchema#double">2</ems:mostLikely>
                           <ems:high rdf:datatype="http://www.w3.org/2001/XMLSchema#double">2</ems:high>
                        </ems:TriangularDistribution>
                     </ems:distribution>
                  </ems:MeasureDistributionCell>
               </ems:measureDistributionCell>
            </ems:FactDistribution>
         </ems:factDistribution>
      </ems:FactDistributionTable>
   </ems:predictsTable>
   <!--
      Other properties of this resource have been omitted for brevity.
   -->
</ems:Estimate>
Displaying the Measurement in the Context of the Estimate
It is a goal of EMS 1.0 to define resource formats that support effective presentation of estimation and measurement information. An EMS 1.0 service provider should offer a number of resource representation formats, such as XML, JSON, Atom, and HTML, to enable a wide variety of clients. However EMS 1.0 does not specify any user interface guidelines.
The information managed by an EMS 1.0 service provider may be presented by any number of other tools, including software estimation, portfolio management, project management, and performance management. In fact, having multiple user interface clients of the information allows for multiple points of view with each tool providing a role-appropriate user interface. The following discussion illustrates a few ways that estimates and measurements may be usefully combined in a user interface.
An estimate can be used to determine if the project is progressing as expected. Since an estimate gives a probability distribution for the expected value of a measurement, we can compute the probability that a measurement is less than or equal to a given value. Mathematically, we map the actual value of the measurement to a probability using the cumulative distribution function for the estimate. If the project is progressing as expected then measurements should lie in the centre of the probability distribution, i.e. they should have a cumulative probability of around 50%. Therefore, the deviation of this probability from 50% gives us a measure of how closely the project is behaving as expected.
We can assign alert levels to various probability ranges. For example, we might consider a deviation of less than 15% to be acceptable, a deviation from 15% to 30% to be a warning, and a deviation greater than 30% to require manager investigation. It is usual to assign the colours green, yellow, and red to these ranges and to colour code the measurements accordingly. The ranges can also be mapped to control limits and used in control charts.
Priyanka has set up her dashboard to show the defect arrival rate on a dial calibrated from 0 to 100% to display the cummulative probability associated with the measurement. She can click on the dial to drill down into the detail of the measurement displayed in a control chart. She has also set up reports that display a variety of other metrics that help her diagnose the root cause of large variance measurements.
Summary Sequence Diagram
The following sequence diagram summarizes the interactions in this act:
Next: Summary
Previous: Act 2. Estimation


