Throughout the month of March the OSLC 2012 Community Survey is open for respondents. Two weeks in we’ve already collected over 70 responses and have some interesting information that we can share. Still, the rate of response has tapered off in this second week …
So, before we get into those details, if you haven’t already taken the survey, please do. If you have already taken the survey (or once you do) please share the survey with your network. If you’ve already shared the survey with your network, please bug them again!
An aside on sharing: use #OSLCSurvey on Twitter, and encourage them to join the OSLC Group on LinkedIn.
Is it unreasonable to expect 200 responses to the survey? If we all help spread the word, that’s not unreasonable at all.
Now, let’s take a look at some interim results of the OSLC 2012 Community Survey. (There isn’t any detailed analysis in what follows, just a quick look at a few of the questions.)
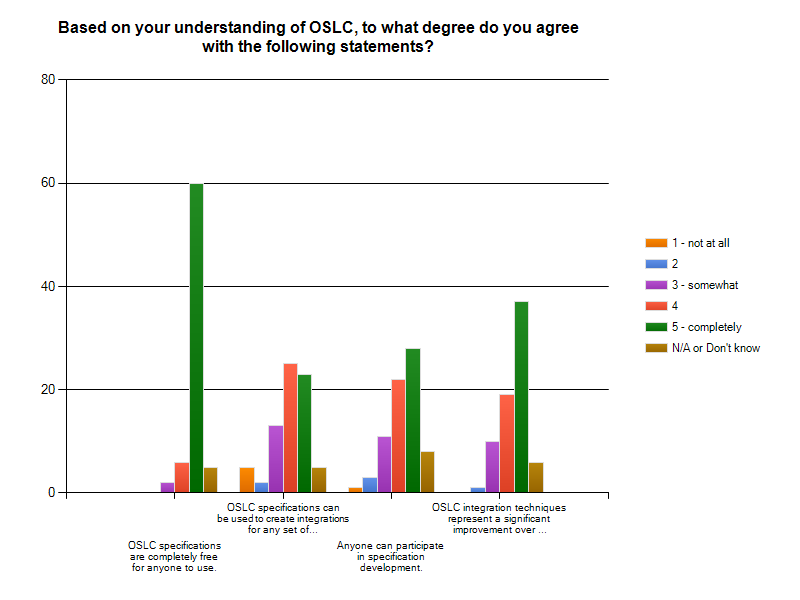
A huge majority of respondents believe that “OSLC specifications are completely free for anyone to use.” However, there is less agreement with the idea that that “OSLC specifications can be used to create integrations for any set of tools.” So we’ve done a good job communicating the truly open nature of OSLC specifications, but have some work to do around the idea that OSLC integrations can be created for software from any vendor. (Or it may be that respondents are thinking about scenarios that are not yet covered by an OSLC specification … if that’s the case for you, why not comment in this forum thread?)
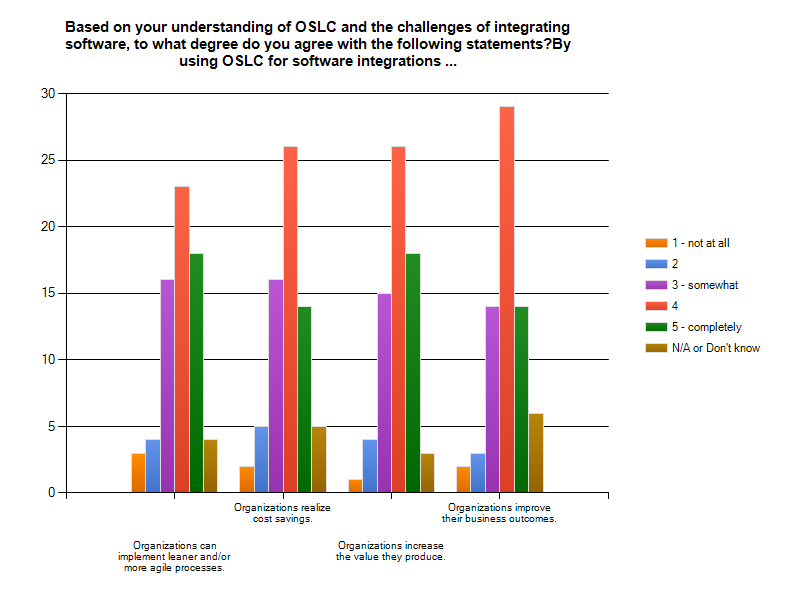
While agreement isn’t as strong, most respondents give positive marks to OSLC for help organizations address the challenges of software integrations and realize more value.
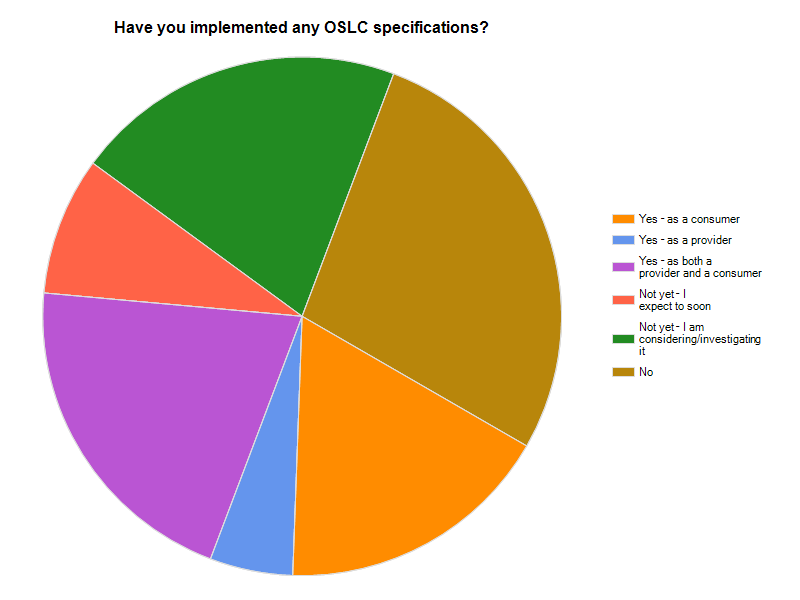
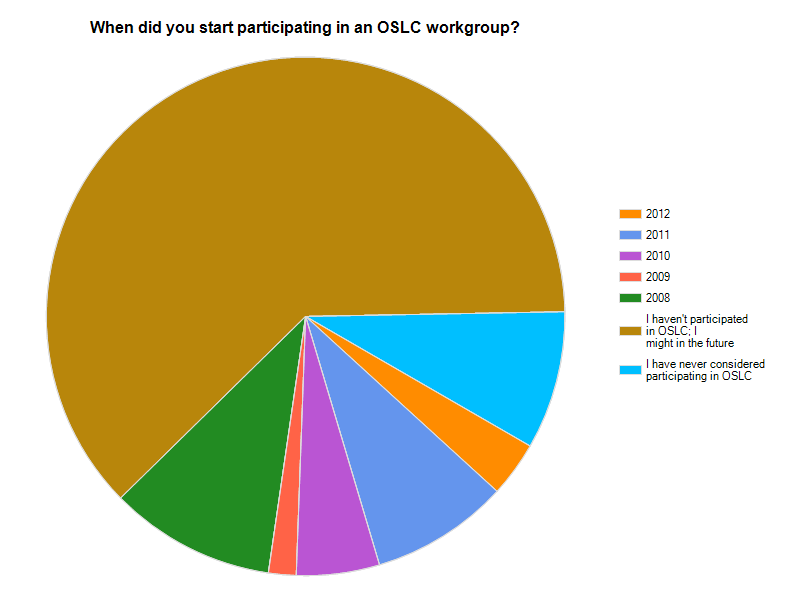
Over 60% of respondents are open to participating in an OSLC workgroup (that’s 88% of those who have not yet participated in any workgroup). Nearly 30% of respondents may implement an OSLC specification in the future (that’s 52% of those who have never implemented a specification). Clearly there is an opportunity to increase community participation and the number of implementations!
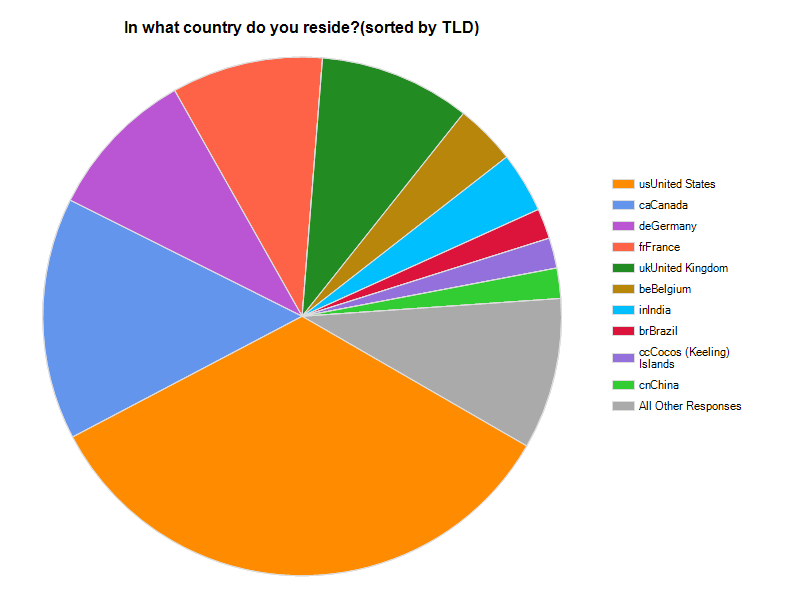
North Americans are accounting for nearly half of our respondents.
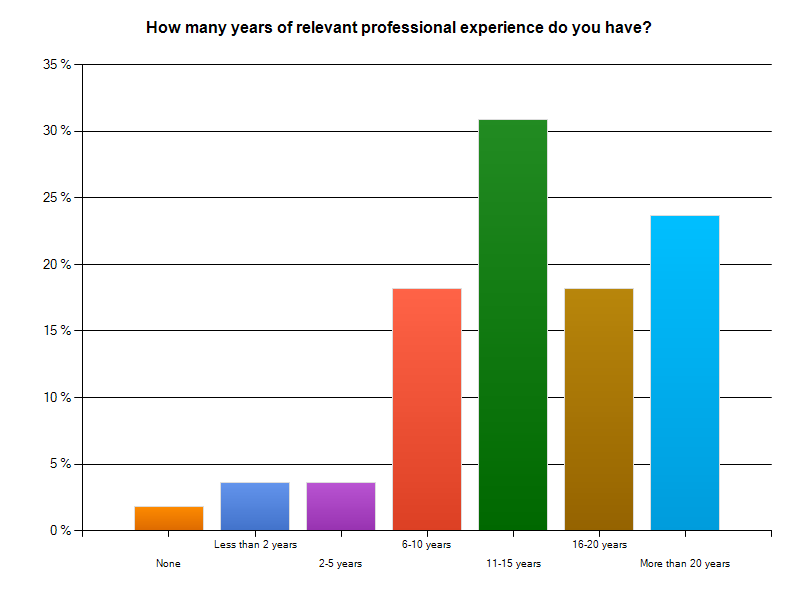
Our respondents tend to have a significant amount of experience.
Finally, one last interesting picture – the map of the survey sections:
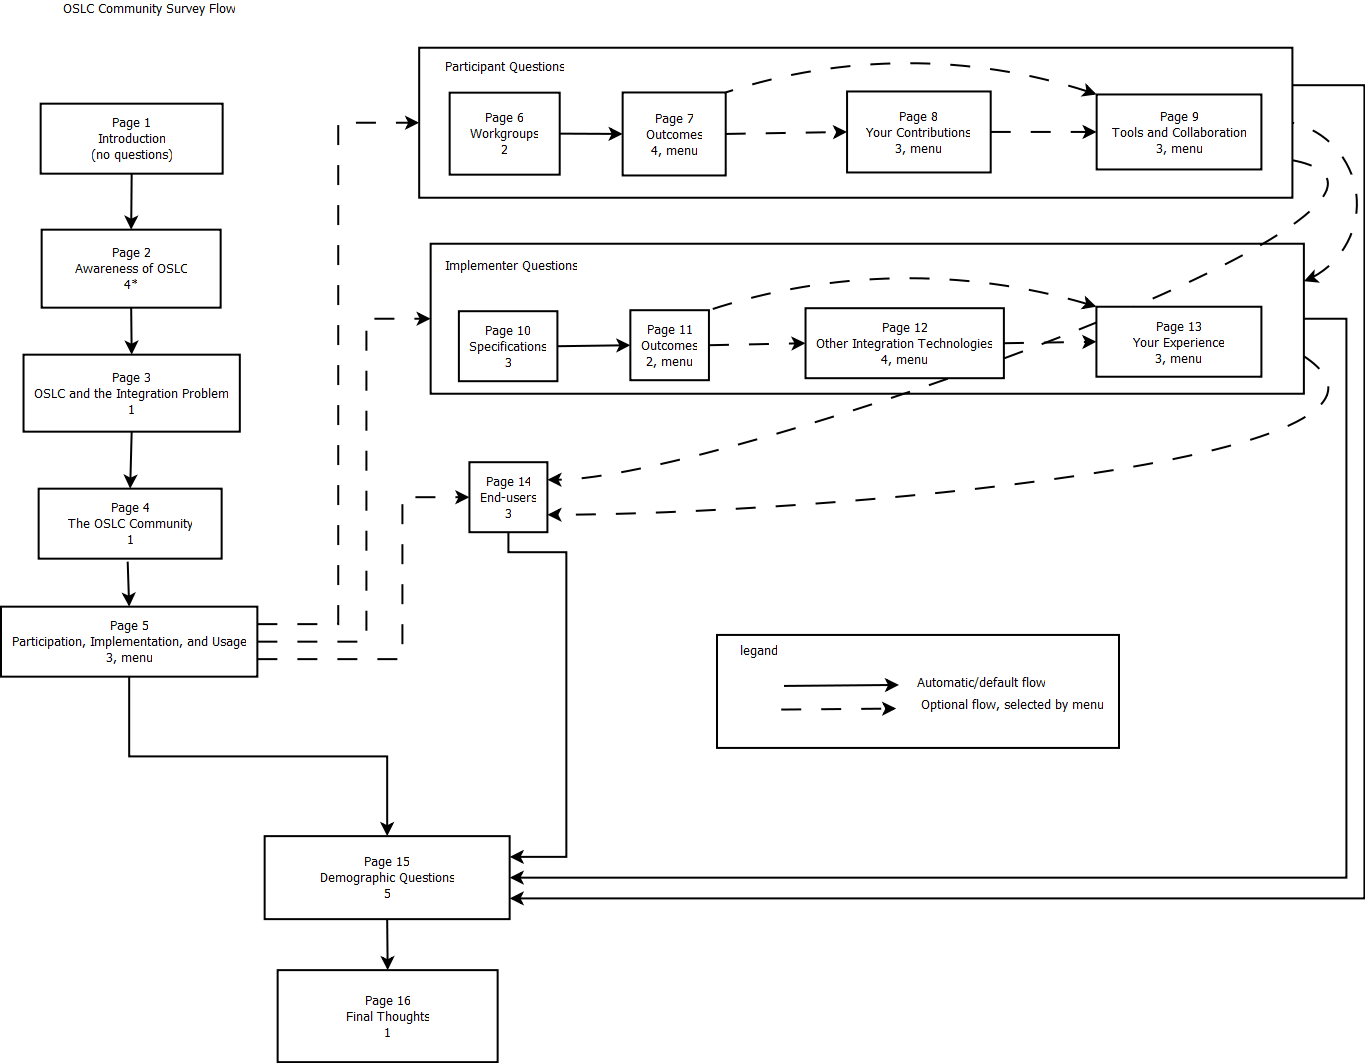
We’ve also had a good number of written responses (in the various “essay” questions). We’ve tweeted some of them before, and we’ll take a closer look at a few of them in another blog post, and, of course, they’ll all be available with the complete survey results once the survey is complete.